Analysis of global linear mean sea level (MSL)
trends, including distance-weighted averaging
* * * D R A F T * * *
by David A. Burton
First version: 11-Dec-2009
Latest major update: 08-May-2010
Latest version:
15-Nov-2021
Contents
- Abstract
- The Data
- Part #1 - Averaging The Data
- Part #2 - Local Variability
- Part #3 - Is the rate of sea level rise accelerating?
- How & Why
- Links to more information
Abstract
159 tide stations with long (avg. ~85 year) Mean Sea Level (MSL) measurement records were selected by NOAA for long term trend analysis, and constitute the best of the GLOSS-LTT designated tide stations for monitoring long term sea level trends around the world. A spreadsheet containing the Local MSL (LMSL) trend data for those stations is available on the noaa.gov web site. (The data for 114 of the tide stations are maintained by the PSMSL in the UK, and the rest are maintained by NOAA in the USA.) I downloaded the spreadsheet and used the data to check the IPCC's claim that sea levels rose ~18 cm during the last century (a rate of 1.8 mm/year).
I averaged the tide station data several different ways (including by weighting stations' LMSL trends according to distance from other stations), and found that the IPCC's claimed 1.8 mm/year rate of global MSL rise exaggerates the actual, measured rate of MSL rise by at least 50%:
|
Furthermore, the IPCC's claims that the rate of sea level rise is accelerating, and that the acceleration has been confirmed by coastal tide gauges, are also untrue. In fact, tide gauge measurements indicate that the global average rate of sea level rise has not measurably accelerated in more than a century.
The Data
For a spreadsheet containing the actual data used, see the Global MSL Trend Table page, here:
http://www.burtonsys.com/climate/MSL_global_trendtable1.html
The information in black on the Global MSL Trend Table page
(years of operation, Local Mean Sea Level trends, and confidence intervals)
is copied directly from NOAA's web site, here:
http://tidesandcurrents.noaa.gov/sltrends/MSL_global_trendtable.html.
(A copy of that web page is also available at http://www.webcitation.org/5mj6OZJq5.)
NOAA has more detailed information for each tide station, including graphs of the LMSL trends, here. For the 114 PSMSL tide stations, see their web site for more information, here.
The green latitude & longitude information was taken from two sources:
1) http://unesdoc.unesco.org/images/0011/001126/112650eo.pdf
(or http://www.burtonsys.com/climate/112650eo.pdf)
2) http://www.pol.ac.uk/psmsl/datainfo/rlr.trends
(or http://www.burtonsys.com/climate/2005-08-03_MSL_pol.ac.uk.bak01.txt)
For all but a few locations, the latitude and longitude listed were identical in the two sources, but a few locations were listed in only one of the two documents, or were listed with very slightly different coordinates in the two sources. In the later case, I averaged the differing coordinates; coincidentally, in all such cases the difference between the two sources was either 1, 3 or 5 minutes of latitude or longitude, so the average shown on the Global MSL Trend Table page ends in ".5" minutes.
The numbers in red are values which I calculated from the other data.
Note: The portion of the Global MSL Trend Table
page preceding the red line is in Microsoft Excel 2000
HTML spreadsheet format. So if you want to load the data into a spreadsheet you can just
load the web page into Excel (version 2000 or later). Doing so will mangle the formatting of the text
after the red line, but the data and formulas above the red line will load correctly, and
the numbers will be represented with greater precision than is shown on the web page.
Data overview
159 stations are listed by NOAA. They've been in operation for an average of ~85 years. Local Mean Sea Level (LMSL) rose at 117 locations, and fell at 41 locations.
The location with both the greatest total increase and fastest rate of increase was Galveston, TX, USA, where mean sea level rose about 63 cm (2.1 feet) over a period of 99 years.
The location with the greatest total decrease was Vaasa, Finland, where mean sea level fell by about 91 cm (3.0 feet) over 124 years, but the location with the fastest rate of decrease was Furuogrund, Sweden, where mean sea level fell at a rate of 8.17 mm/year (2.68 feet/century) over 92 years.
The location with the median rate of LMSL change was Prince Rupert, Canada, where MSL rose at a rate of 1.09 mm/year (0.358 ft/century).
Only 52 of 159 locations had LMSL rates of increase which were greater than the IPCC's claimed
global average of 1.8 mm/year.
At 65 of the remaining 107 locations, the LMSL trend was up, but by less than 1.8 mm/year.
At one location the LMSL trend was flat (neither up nor down).
At the other 41 locations, the LMSL trend was down.
Part #1 - Averaging The Data
There are two simple, obvious ways of averaging the LMSL trend numbers, and I've done both. One way is to weight each measurement location equally. The other way is to weight each station-year equally; that is, to weight each measurement location according to how long it was in operation, so that a station which was in operation for 100 years would have twice the weight of a station which was only in operation for 50 years.
It turns out that it doesn't make much difference in the result.
The average MSL change is +0.611 mm/year if each station is weighted equally.
The average MSL change is +0.458 mm/year if station-years are weighted equally.
Summarizing:
0.00358 ft/year = 1.090 mm/year = 4.29 inches/century (median)
0.00200 ft/year = 0.611 mm/year = 2.41 inches/century (average1)
0.00150 ft/year = 0.458 mm/year = 1.80 inches/century (average2)
0.00175 ft/year = 0.535 mm/year = 2.10 inches/century ((avg1+avg2)/2)
0.00236 ft/year = 0.720 mm/year = 2.83 inches/century ((med+avg1+avg2)/3)
Average weighted by geographical distances:
A less obvious way of averaging the LMSL trend numbers is geographically: i.e., by weighting the tide stations in sparsely sampled areas of the earth more heavily than those in areas which have many tide stations.
To do that properly, we must first know something about the granularity of the physical mechanisms (such as postglacial crustal rebound) which cause LMSL trends to vary between locations. In other words, how near must two tide stations be to each other for their LMSL trends to be more closely correlated than are the LMSL trends measured at stations which are widely separated?
To answer that question, I calculated two numbers for every pairing of tide stations.
There are 159 stations in the GLOSS-LTT set, so there are (159x158)/2 = 12,561 pairs.
For each pair, I calculated the distance between the two stations, and the difference
between their LMSL trends. Then I graphed them, with distance on the X-axis and
difference between LMSL trends on the Y-axis. The result is here:
http://www.burtonsys.com/climate/MSLtrend_v_distance.htm
(or here)
(Note: the program to do the calculations is written in Perl. It reads and writes
.csv data files (which can be exported from and imported to Excel). You can download
the code and .csv data files here: code.zip.
The resulting web page is an exported Excel spreadsheet, and the graph is an
Excel-generated XY chart.)
From the graph we can see that only at distances less than about 800 km is there any
increase in correlation at all, and only at distances less than 400 km is there
a substantial increase in correlation between LMSL trends measured at pairs of tide
stations. Here's the same graph, but limited to station pairs which are less
than 2500 km apart:
http://www.burtonsys.com/climate/MSLtrend_v_distance_to_2500km.htm
(Aside: From this, one fact seems apparent: 159 tide stations are not really enough to thoroughly sample the world's ocean coastlines, which I guess probably total a few hundred thousand km. To address that problem, I sought a larger list of tide station LMSL trend measurements. I found one here [copied here], with 1113 tide stations. Unfortunately, when I repeated the previous exercise with this data, the result (or here) didn't appear to show any greater correlation at all between LMSL trends at nearby tide stations. I suspect that was because of the poor quality of the data for many tide stations, which had been in operation only a few years, and the fact that many of the comparisons were between tide stations which had been operating during different time periods. It seems that the GLOSS-LTT stations are the cream of the crop, with the best available data.)
To weight tide station locations by distance, on the basis of the above graph, note that correlation weight W must be = 1 when distance D is 0, and W = 0 when distance D is greater than 800 km. Or, in terms of the graphs, W = 1 when Y = 0.00, and W = 0 when Y = 3.00.
I used a very simple piecewise linear approximating function for the graph, based on these data points:
|
Or, in Perl:
if (D <= 400) {Y = 2*(D/400);}
elsif ((D>400)&&(D<800)) {Y = 2+((D-400)/(800-400));}
elsif (D >= 800) {Y = 3;}
Y_norm = Y / 3;
W = 1 - Y_norm;
Graphed, it looks like this (in red):
Using the above function, I wrote a Perl program which did the following:
- Read the 159 GLOSS-LTT tide station records, noting the Local Mean Sea Level (LMSL) trend for each station and the station's coordinates.
- For each tide station location, check the location against every other location, calculating the distance D between the two locations, and the correlation weight W calculated from the distance according to the piecewise-linear approximating function (above).
- Also, for each tide station location, sum the correlation weights of all nearby tide stations.
- For each station, calculate its own weight W_own (to a maximum of 1.0) from the
summed correlation weights of the nearby stations, according to the formula:
W_own = 1.0 / (1.0 + sum(nearby_weights))
(Aside: this means an isolated station has a weight of 1.0, but a station near other stations has a lower weight. E.g., a station which is very near to just one other station has a weight of about 0.5.) - Write the W_own weights to a file, geo_weights.csv, for subsequent import into Excel. (The geo_weights.csv file is included in code.zip)
- Calculate the geographically weighted average linear MSL trend from all 159 stations, by multiplying each station's W_own weight by its LMSL trend (in mm/year), summing them, and dividing the sum by the sum of the stations' W_own weights. (This same calculation is also done in columns 17 & 18 of the MSL_global_trendtable1.html spreadsheet.)
- Calculate the combined, geographically weighted standard deviation and 95% confidence interval. (This same calculation is also done in the last two columns of the MSL_global_trendtable1.html spreadsheet.)
The result is a geographically-weighted global average linear MSL trend of +1.133 mm/year (4.46 inches/century) ± 0.113 mm/year (95% confidence interval).
I also tested a wide range of other hypothetical maximum distances of Local MSL trend correlation. None of them resulted in a weighted average linear MSL trend of more than about +1.2 mm/year.
The Perl program to perform these calculations and the .csv data input file are both
included in the aforementioned code.zip archive.
Detailed instructions for how to run the program and duplicate these results (using
either Windows or Linux) are here.
Summary
I averaged the tide station data several different ways, and, regardless of how the data was averaged the result was that the IPCC's claimed 1.8 mm/year average rate of MSL rise exaggerates the actual, measured rate of MSL rise by at least 50%:
|
Conclusion #1
According to NOAA's data, averaged several ways, global mean sea levels have been
creeping up at a rate of at most about 1.1 mm/year (4.5 inches per century).
That is only two-thirds of the 1.7 to 1.8 mm/year rate which the IPCC claims.
Part #2 - Local Variability
Although the global average rate of MSL change is, at most, only about 1.1 mm/year, most sites have historically seen larger changes than that, because the average includes both locations where the sea level is increasing and locations where the sea level is decreasing. The "Absolute value of MSL Trend" column shows how much sea level change (up or down) is experienced by each site, and the average is about 2.07 mm/year (8.16 inches/century).
That means much (probably about half) of the LMSL trend at most sites is due to local conditions, rather than the global MSL trend.
The significance of that fact is that it means changes in the global average rate of MSL rise are of much less significance than you might expect. This is shown by the 9th-12th columns, in which the effect of hypothetical increases in rate of global MSL rise are calculated.
In fact, for 37 tide station locations which have been experiencing large decreases in sea level, a 0.6 mm/year (>50%) increase in the global average rate of MSL rise would actually reduce the rate of Local MSL change experienced at those locations.
For locations which have been experiencing increases in sea level, an increase in the global average rate of MSL rise would increase the amount of change experienced at those locations, but often by a relatively small amount compared to the change which they have already been experiencing.
In the columns labeled "MSL Trend +0.6mm/yr" and "Absolute value of MSL Trend +0.6mm/yr" I calculate the local effect at each station of a 0.6 mm/year (i.e., more than 50%) increase in rate of global average mean sea level rise. The average amount of change (up or down) experienced by the 159 locations would increase from the 20th century rate of 2.07 mm/year to about 2.40 mm/year, which is just a 16% increase.
In the column labeled "MSL Trend +1.2mm/yr" I calculate the local effect at each
station of a 1.2 mm/year (more than 100%) increase in rate of
global average mean sea level rise. The average amount of change (up or
down) experienced by the 159 locations would increase from
2.07 mm/year to about 2.78 mm/year, which is still only a 34% increase.
Conclusion #2
Because of the large variation in rate of sea level change between different seaside
locations, changes in the global average rate of sea level increase have much less effect
on seaside communities than one might guess. Even more than doubling the global average
rate of Mean Sea Level rise would cause only a 34% average increase in the rate of sea
level change experienced by seaside communities.
Part #3 - Is the rate of sea level rise accelerating?
The IPPC says sea levels are rising at an accelerating rate. Their "Fourth Assessment Report" (a/k/a "AR4") says (or here):
"Sea level indicators suggest that global sea level did not change significantly from [between 3,000 and 2,000 years ago] until the late 19th century. The instrumental record of modern sea level change shows evidence for onset of sea level rise during the 19th century. Estimates for the 20th century show that global average sea level rose at a rate of about 1.7 mm/yr...
"Satellite altimetry... shows that since 1993, sea level has been rising at a rate of around 3 mm/yr, significantly higher than the average during the previous half century. Coastal tide gauge measurements confirm this observation..."
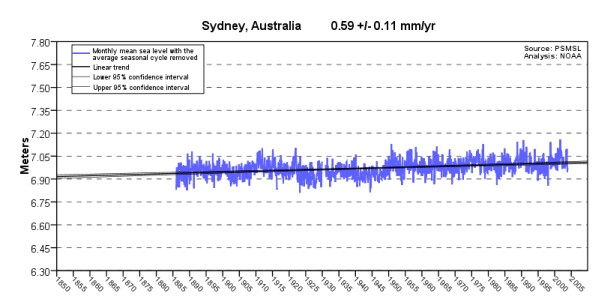
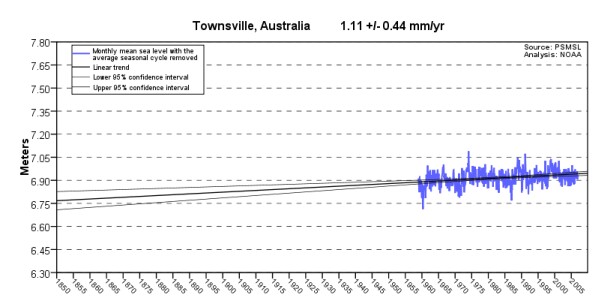
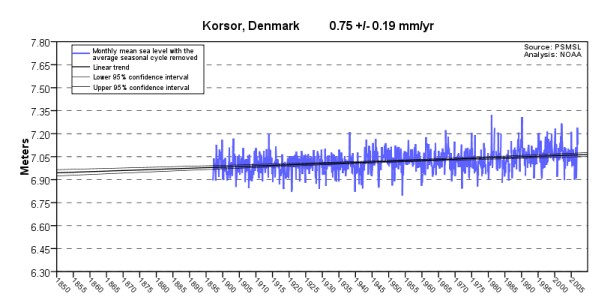
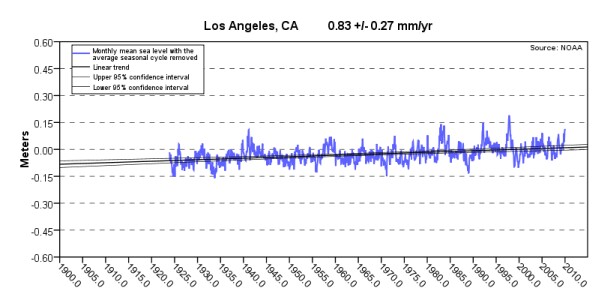
The IPCC is wrong. If you view the Local MSL graphs for the GLOSS-LTT tide
stations you can't help but notice that there has been no sustained increase in MSL trend since
1993 – nor any other time in more than a century. You can click on the tide station names
in the MSL Trend Table to see any of
the graphed Local Mean Sea Level trends on the NOAA.gov web site. Here are some samples
(click on the graphs for bigger versions):
But what about Church & White?
In Church & White's oft-cited 2006 paper, they claimed to have detected, “A 20th century acceleration in global sea-level rise.” (That was the title of their paper.)
In the opening paragraph, they wrote,
“...we extend the reconstruction of global mean sea level back to 1870 and find ... a significant acceleration of sea-level rise of 0.013 ± 0.006 mm/yr². This acceleration is an important confirmation of climate change simulations...”
If you only read that opening paragraph, it sounds compelling – and somewhat dire:
“If this acceleration remained constant then the 1990 to 2100 rise would range from 280 to 340 mm, consistent with projections in the IPCC TAR.”
But there are major problems with that conclusion.
First, there is good reason to question the correctness of the corrections and averaging methodology which Church & White applied to obtain global averages from the tide gauge data.
Their
corrected/
Plus, there's this remarkable admission in paragraph 5 of their paper:
“An additional spatially uniform field is included in the reconstruction to represent changes in GMSL. Omitting this field results in a much smaller rate of GMSL rise...”
What that sounds like to me is that they got the "wrong" result, so they added a fudge factor!
Second, even if we accept their data, their conclusions are wrong.
They admitted that “no 20th century acceleration has previously been detected” by other researchers. That obviously suggests that somebody must be wrong, either Church & White or those other researchers.
Later in their paper we read that (despite the title of their paper) the reported 0.013 mm/yr² acceleration wasn't true for the 20th century, after all. The greatest acceleration occurred in the 19th century. The 0.013 mm/yr² figure resulted from combining the higher 19th century acceleration with the lower 20th century acceleration. Midway through the paper they wrote that, “for the 20th century alone, the acceleration is smaller at 0.008 ± 0.008 mm/yr².”
What's more, they also noted that there was a “clear change of slope at ~1930,” and “much of the acceleration occurr[ed] in the first half of the 20th century rather than a smooth acceleration over the whole period.”
That's a major understatement! Actually, according to their data, there was no acceleration at all in the rate of sea level rise over the last 70 years of the 20th century. All the 20th century acceleration occurred before 1930. Though you won't read it in their paper, according to their data & methodology, since 1930 the rate of sea level rise has actually decelerated!
Yet they still wrote, “If this acceleration remained constant...” when they obviously knew the acceleration hasn't remained constant, and in fact ceased entirely, more than 70 years ago!
The fact that sea levels began to rise (slowly) in the late 19th century, following the end of the Little Ice Age, is well known, and uninteresting. That rise is continuing. The interesting question is how much acceleration occurred later, after humanity began producing CO2 at dramatically increased rates. The answer (which you won't find in Church & White's paper) is little or none.
Church
and White wrote that, “Fitting a quadratic to
the GMSL time series gives an acceleration (twice the quadratic
coefficient) of 0.013 ± 0.006 mm/yr²
(95%) for 1870 to 2001.”
(Note: when I did that, I got somewhat different numbers.)
What they didn't mention is that fitting a quadratic to their GMSL
time series for 1930 (or 1935) to 2001 (or 2007 for the newer data)
yields a negative quadratic coefficient:
Using their original data yields a deceleration of 0.007 mm/yr² for 1930 to 2001, and their latest data yields a deceleration of 0.013 mm/yr² for 1930 to 2007 – coincidentally the exact same magnitude (but opposite sign) as the 1870-2001 acceleration which they called “an important confirmation of climate change simulations.”
Why don't I expect Church & White or the IPCC to announce “an important falsification of climate change simulations?”
It
is possible to cherry-pick starting points to show either
acceleration or deceleration of sea level rise during the 20th
century, using Church & White's data and method. For instance,
using 1940 as the starting year shows deceleration, and using 1950 as
the starting year shows acceleration. Likewise,
choosing the last 100 years (1907 to 2007) yields a very small
acceleration, and choosing the last 95 years (1912 to 2007) yields a
very small deceleration (though in both cases the amount is so tiny
that the quadratic curve appears to be perfectly straight):
(Note: the graphs, and the linear and quadratic fits to them,
were created with Microsoft Excel 2000. You can download the spreadsheets and
data files here: code.zip.)
The
bottom line is that, even according to Church & White's data, sea
level rise has been essentially linear for the last century, even
though CO2 emissions have gone up dramatically. The record of the
20th century gives no reason to expect a significant
acceleration in the rate of sea level rise during the 21st.
Conclusion #3
The IPCC's claim that "coastal tide gauge measurements confirm" an accelerating rate of MSL rise is nonsense.
If the global MSL trend had actually accelerated by about +1.3 mm/year since 1993, as the
IPCC claims, that fact would be apparent at these tide stations, as a doubling or tripling
of the measured rate of MSL rise. But there is no evidence of any such acceleration.
The global average Mean Sea Level has been rising at a slow, steady rate of less than 1.2 mm/year
for more than a century – i.e., since long before there was any major human contribution to
atmospheric CO2 levels. The obvious conclusion is that anthropogenic CO2 does not appear
to cause a significant increase in the rate of sea level rise.
How & Why
The obvious question is, "How did the IPCC's AGW alarmists get it so wildly wrong?"
Or, first off, is it possible that the IPCC is right? For instance, is it possible that the GLOSS-LTT list of 159 locations is so unrepresentative of the world as a whole, that it drastically understates 20th century global average MSL rise?"
That seems very unlikely. The 45 NOAA-maintained stations and 114 PSMSL-provided stations represent what appears to be a pretty good geographic distribution (though Africa is noticeably underrepresented), and the best available data on sea level trends. They are the 159 stations (or here) which were designated in 1997 as GLOSS-LTT stations for monitoring long-term sea level trends. I'm aware of no evidence that the locations were poorly chosen. (In fact, the main problem with deducing long term sea level trends from tide gauges is that they tend to be in urban areas where pumping of wellwater often causes local subsidence, resulting in overestimation of MSL rise.)
So how did the IPCC get it so wrong? The answer, at least in part, is that they've been adjusting the numbers with "correction factors" for vertical land motion, based on theoretical models (or here) rather than actual measurements, and their corrections greatly inflate the reported rate of sea level rise. Unfortunately, it seems that their models are better at correcting for upward land movement (post-glacial rebound) than for downward land movement (coastal subsidence), which biases their results.
The best explanation I've found is by the late John L. Daly (whose
untimely death the UEA CRU's Phil Jones infamously found "cheering"), here:
Testing the Waters: A Report on Sea Levels for the Greening Earth Society (or here):
Here's a key quote from Daly's paper:
"The impression has been conveyed to the world's public, media, and policymakers, that the sea level rise of 18 cm in the past century is an observed quantity and therefore not open to much dispute. What is not widely known is that this quantity is largely the product of modeling, not observation, and thus very much open to dispute, especially as sea level data in many parts of the world fails to live up to the IPCC claims."
This paper is long, but very readable, and well worth careful study.
Dave Burton
Cary, NC
![]()
First version: 11-Dec-2009
Last modified:
15-Nov-2021 (version 29)
(The “last modified” date & version number
are maintained automatically by TLIB Version Control.)
For more climate info see:
http://www.burtonsys.com/climate
For how to use the Perl programs to examine a variety of "what if" scenarios, see:
http://www.burtonsys.com/climate/whatif.html
(e.g., "what if we discard the N tide stations with lowest MSL trends?")
Here's a short link to this page: http://tinyurl.com/MSLavg2.
For discussion of this work see the climatesceptics yahoo group